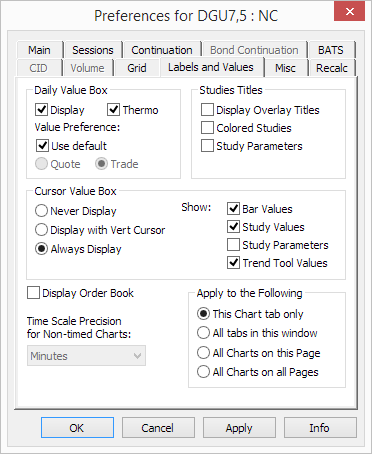
These preferences are used to change the display of the Daily Value Box, study titles, the Cursor Value Box, and the Order Book.
To access these settings, click Setup, then Chart Preferences, and then click the Labels and Values tab.
To display the Daily Value Box, click the Display check box in the Daily Value Box section of preferences.
The Daily Value Box in the upper-left corner of the chart displays the open, high, low, last trade, close, and net change from the prior close. Optionally, you can display a thermometer (Thermo check box).
Using the Studies Titles parameter, you can choose to display the study name or parameters on the Daily Value Box.
Value Preference allows you to control how the last and net change values are displayed on the chart.
If Use default is selected, then the system uses your preferences, including a BATS filter. If preferences aren’t set, then it uses the CQG default. If the BATS filter is using bids or asks, then bid and ask values are used in the bars. The last and net change values are based on the last quote (trade, bid, or ask) received. Otherwise, they are based on the last trade or settlement.
If the Quote button is selected, then the last and net change values are based on the last quote (trade, bid, or ask) received.
If the Trade button is selected, then last and net change values are based on the last trade or settlement received.
Study titles and parameters can be displayed on the Daily Value Box.

Click Display Overlay Titles to include the study name in the box.
Click Colored Studies to change the study name and parameters from black.
Click Study Parameters to include study parameters in the box.

•Click Never Display to hide the Cursor Value Box.
•Click Display with Vert Cursor to show the Cursor Value Box only in conjunction with a vertical cursor.
•Click Always Display to show the Cursor Value Box at all times.
You can add study and trend data to the Cursor Value Box using the Show parameter.
Bar, study, and trend data can be displayed on the Cursor Value Box.
•Click Bar Values to include the open, high, low, and close for the bar.
•Click Study Values to include a study in the box.
•Click Trend Tool Values to include the trend value in the box.
•Click Study Parameters to include study parameters in the box.


Select this check box to add the Order Book to the chart.
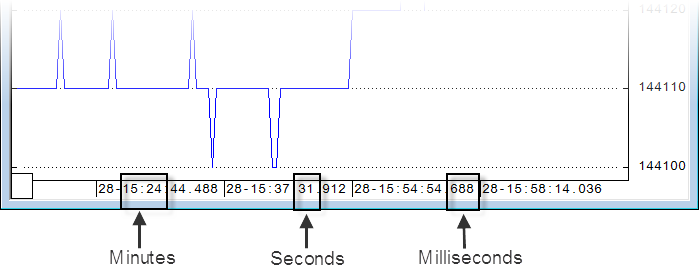
Time Scale
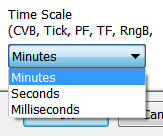
The time scale on Tick, TFlow, CVB, tick-based Point and Figure, and Range Bar charts display minutes, seconds, and milliseconds.