Market Profile charts display price distributions over a period of time. The Market Profile feature includes Market Profile distributions and CQG volume profiles.
Your chart may look considerably different depending on the display parameters you have chosen.
You can work with Market Profile charts in many of the same ways you work with other charts. The only study that can be added to the Market Profile is the Order Display study.
Most of the features common to all CQG charts are available for Market Profile also, such as adding conditions to the chart.
Market Profile is a registered trademark of CME, ©2011 Chicago Mercantile Exchange. ALL RIGHTS RESERVED.
See also: Working with Order Study Values on Market Profile
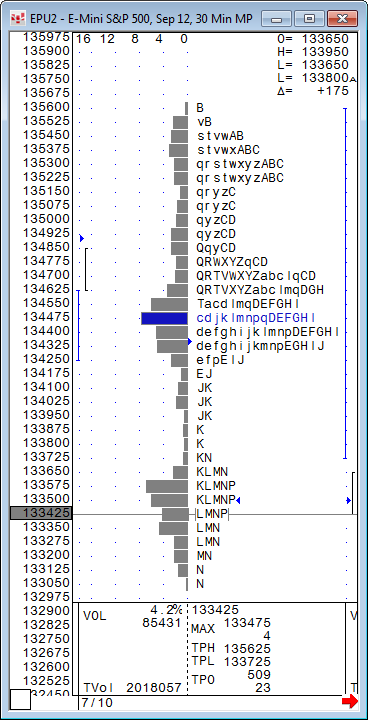
CQG has created a simple, yet elegant instance of Market Profile charts, which include TPO distribution, volume bars, and helpful markers and indicators. CQG standard chart elements, such as the cursor value box and horizontal lines, have been adapted for the Market Profile chart.
Time Price Opportunity (TPO) Distribution
Market Profile distributions are constructed of TPOs (Time Price Opportunities). Each TPO letter identifies a time when the market traded at the price indicated on the vertical axis. CQG line time (United States Central Time) is used.
TPO letter values change depending on whether the chart is 30-min, daily, or monthly.
30-Min
|
TPO |
Time |
TPO |
US CST Time |
|
A |
800 |
a |
2000 |
|
B |
830 |
b |
2030 |
|
C |
900 |
c |
2100 |
|
D |
930 |
d |
2130 |
|
E |
1000 |
e |
2200 |
|
F |
1030 |
f |
2230 |
|
G |
1100 |
g |
2300 |
|
H |
1130 |
h |
2330 |
|
I |
1200 |
I |
2400 |
|
J |
1230 |
j |
30 |
|
K |
1300 |
k |
100 |
|
L |
1330 |
l |
130 |
|
M |
1400 |
m |
200 |
|
N |
1430 |
n |
230 |
|
P |
1500 |
p |
300 |
|
Q |
1530 |
q |
330 |
|
R |
1600 |
r |
400 |
|
S |
1630 |
s |
430 |
|
T |
1700 |
t |
500 |
|
V |
1730 |
v |
530 |
|
W |
1800 |
w |
600 |
|
X |
1830 |
x |
630 |
|
Y |
1900 |
y |
700 |
|
Z |
1930 |
z |
730 |
When a contract opens during a particular TPO, the first thirty minutes of trading for that contract are plotted using the letter of the TPO that was in progress at the opening. Subsequent trades are plotted using the letter of the TPO in progress at the beginning of the corresponding 30-minute interval. For example, if the opening time of the day session for a symbol is 7:20 a.m., the y TPO applies. The second thirty minutes of trading, which starts at 7:50 a.m., corresponds to the z TPO.
For time periods shorter than 30-minutes, a TPO applies to the same 30-minute period. For example, a 5-minute Market Profile would contain six 5-minute A TPOs.
Daily
|
TPO |
Date |
TPO |
Date |
|
A |
1 |
R |
17 |
|
B |
2 |
S |
18 |
|
C |
3 |
T |
19 |
|
D |
4 |
V |
20 |
|
E |
5 |
W |
21 |
|
F |
6 |
X |
22 |
|
G |
7 |
Y |
23 |
|
H |
8 |
Z |
24 |
|
I |
9 |
a |
25 |
|
J |
10 |
b |
26 |
|
K |
11 |
c |
27 |
|
L |
12 |
d |
28 |
|
M |
13 |
e |
29 |
|
N |
14 |
f |
30 |
|
P |
15 |
g |
31 |
|
Q |
16 |
| |
Monthly
|
TPO |
Month |
TPO |
Month |
|
A |
January |
G |
July |
|
B |
February |
H |
August |
|
C |
March |
I |
September |
|
D |
April |
J |
October |
|
E |
May |
K |
November |
|
F |
June |
L |
December |
Both upper and lower case u and o are not used.
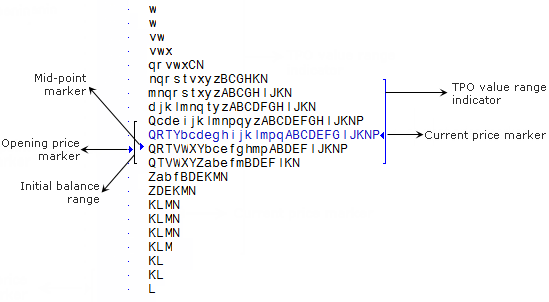
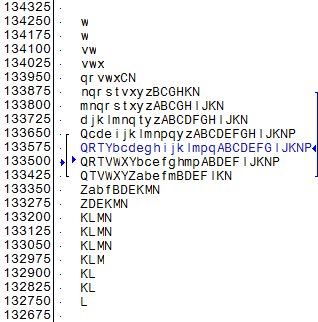
Initial balance range: Identifies the first two trading periods of a distribution. Change the number of trading periods identified by changing the IBR Period parameter.
Opening price marker: Identifies the opening price of the trading session displayed.
Mid-point marker: Identifies the midpoint of the trading range for each distribution.
Current price marker: Identifies the current price for an active session or the closing price for a closed session.
TPO value range indicator: Identifies the range where 70% of the TPOs occurred.
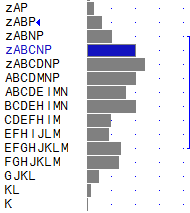
Volume profiles are horizontal bar graphs that appear to the right of each Market Profile distribution.
The line to the right of the volume is the volume value area, which identifies the range in which 70% of each contract’s actual volume occurred.
There are two types of volume profiles: tick volume and actual (exchange) volume.
•Tick volume represents the number of inside price changes, i.e. the count of how many times a last price has been changed over a time period.
•Actual volume profiles not only report the prices, but also report the volume that occurred at each price. The exchanges that provide actual price-volume information typically do so after trades have cleared.
Use the volume buttons to display volume on the chart. You can remove the volume using those buttons or by right-clicking the chart and then clicking Volume.
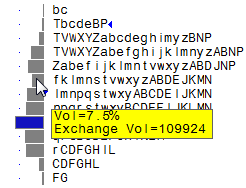
Hover the mouse over the volume to display a tooltip that provides both actual volume and volume percentage:
Right-click the volume, and then click Move Volume to the Right or Move Volume to the Left to move the volume bars. Here the bars have been moved to the right (in the previous image, they are on the left):
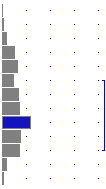
Session Separators

Session separators are dotted vertical lines that appear in the background of a Market Profile. They identify the beginning of each trading session. For longer period Market Profiles, they mark the beginning of each distribution. For example, on monthly Market Profiles, they indicate the beginning of the year.
Market Profile Cursor Value Box
The values in the box correspond to the location of the horizontal line cursor on the chart. For example, the top price in the Cursor Value Box indicates that the cursor is at 130050:

If no cursor is active, then the information pertains to the most recent horizontal line.
|
VOL |
Percent and actual volume at this price. In the example, 8.1% and 157407. |
|
TVol |
Total volume. Here, 1952774. |
|
MAX |
Price that has the maximum number of TPOs for the row selected. It is followed by the number of TPOs for this price. In the example, the price is 135025 and the number of TPOs is 6. If there are several prices in a row with the same number of TPOs, the price closest to the center of the price range is used. |
|
TPH |
Time Price High |
|
TPL |
Time Price Low |
|
TPO |
TPO counts above and below the cursor. However, tails that are only 1 TPO long are not counted. In the example, there are 298 TPOs above the cursor and 170 TPOs below the cursor. |