CQG offers two types of market scans: standard and tiered.
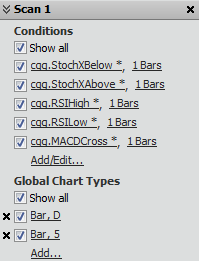
The standard market scan applies a set of conditions for a particular chart type or chart types to a portfolio (Scan 1).
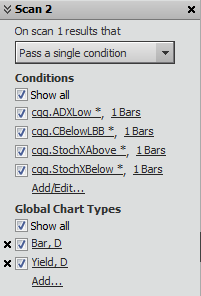
A tiered market scan applies a set of conditions for a particular chart type or chart types to the results of the first scan. You can have up to three scans in a tiered scan.
Scan 1 = standard scan
Scan 1 + 2 = tiered scan
Scan 1 + 2 + 3 = tiered scan
In this example, Scan 1 determines whether any of the symbols in the portfolio meet the Stochastics Falling and Stochastics Rising condition in both a 10-minute bar chart and a constant volume bar chart.
Scan 2 determines which of the symbols that passed one of those conditions have a new high in the last 10 bars on a 10-minute bar chart.
You can include a maximum of 20 conditions in a scan.
Once you have created the scan, you can run it.
To create a standard market scan
1. Click the Browse button at the top of the window to select a portfolio.
2. Click the Add/Edit link under Conditions. Conditions are unavailable if no chart type is listed.
3. On the Specify Market Scan Conditions window, choose the conditions you want to apply to the portfolio, then close that window. You can also open this window by clicking a condition name.
4. To change the bars, click the bar link to open the Define Bar Range window. Make your changes, and then close that window.
5. Click the Add link under Global Chart Types.
6. On the Main Preferences window, select the Chart Type and Time Interval for the scan, then close that window.
7. At the bottom of the window, select which rows to show in the scan results.
To create a tiered market scan
A tiered market scan adds Scan 2 and Scan 3 (optional) to Scan 1.
1. Follow the steps to create a standard market scan.
2. Click Scan 2 to open the scan options.
3. Using the menu, select the results from scan 1 that you want to include. For example, you may want to scan all of the results that passed a single condition.
4. Click the Add/Edit link under Conditions.
5. On the Specify Market Scan Conditions window, choose the conditions you want to apply to the portfolio, then close that window. You can also open this window by clicking a condition name.
6. To change the bars, click the bar link to open the Define Bar Range window. Make your changes, and then close that window.
7. Click the Add link under Global Chart Types.
8. On the Main Preferences window, select the Chart Type and Time Interval for the scan, then close that window.
9. At the bottom of the window, select which rows to show in the scan results.
Click the Load button. The Market Scan Load window opens.
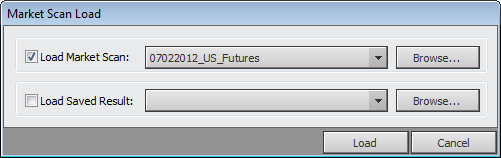
•To load a previously saved setup, click the Load Market Scan check box and select a saved setup using the Browse button.
•To load a previously saved setup and result, click the Load Saved Result check box and select a saved result using the Browse button.
To use the wizard to define a market scan
1. Click the New button.
2. Click Next.
3. Enter a name for the Market Scan.
4. Select a saving option.
5. Click Next.
6. Click the Specify Conditions button and define the condition.
7. Close that window, and click Next.
8. Click the Specify Portfolio button and select the portfolio.
9. Close that window, and click Next.
10. Click Finish.