A Range Bar chart is a non-time-based chart constructed of bars that indicate price movement as a way to help expose trends and volatility. A bar is created each time a trade occurs outside of the previous bar’s stated price range, which you set in preferences.
Range Bar charts can be used for regular symbols and their inversions but cannot be used for synthetic strategies and other complex expressions.
Range Bar charts can be used to measure the duration of a bar with:
•trading systems, custom studies, and conditions;
•MinSinceBarOp and SecSinceBarOp functions; and
•Volume (Vol) study.
These charts are available through API and RTD.
Range Bar calculation
The BATS filter indicates which ticks to use in the calculation: bid, ask, or trades. (Settlement is ignored.)
Calculation rules:
•Except for the first and last bars of a session, each bar must have a high-to-low range that equals the specified range.
•Except for the first and last bars of a session, each bar must open outside of the high-to-low range of the previous bar.
•Except for the first and last bars of a session, each bar must close at either its high or its low.
•A new bar must be started at session open. The first tick price is used as an open price for a range bar.
•The current bar must be closed at session close.
Range Bar charts have no gaps, meaning that if price changes by a multiple of a specified tick/price increment the number of bars that will be drawn on the chart will be proportional to total price move divided by specified tick/price increment. In CQG we refer to such bars as null bars.
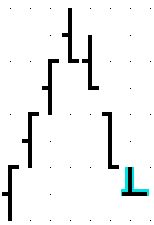
Range Bar example
Range = two
Range unit = tick

1. The first bar opens at 8175.5.
2. The next quote is a new high of 8176.0, which is within the high-low (8176.0-8175.5) range of two ticks.
3. The next quote is a new low of 8175.0, which is also within the high-low (8176.0-8175.0) range of two ticks.
4. The next quote is a new low of 8174.5, which is out of the high-low (8176.0-8175.0) range of two ticks, so a new bar is started with an open of 8174.5.
Candlestick and line charts are calculated the same way. Both bar and candlestick charts display four outputs: open, high, low, close. Line charts display only one output, close, and the chart is drawn by connecting the closes of each bar.
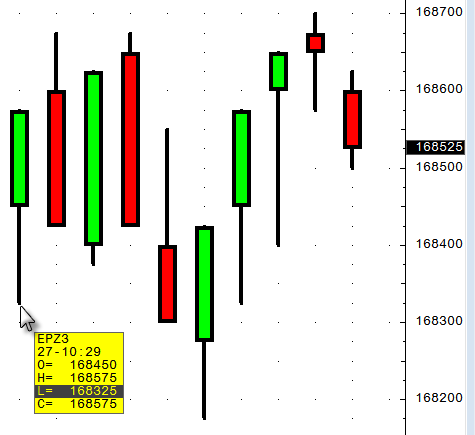
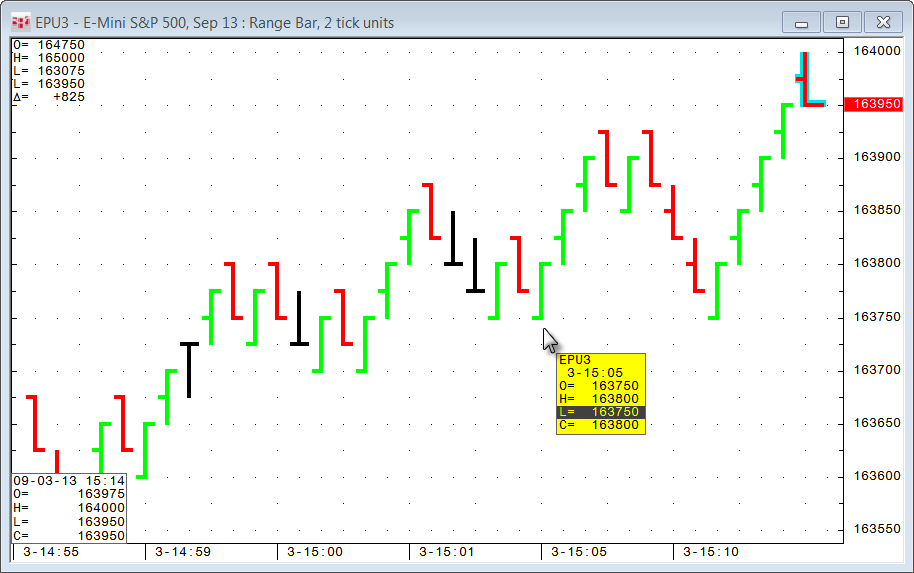
Range Bar display
A Range Bar chart can be displayed as a bar, line, or candlestick chart via Display parameters.
Price Gaps
Because bars are created only if the price is out of the range, a single bar may cover, for example, a minute or several hours depending on market volatility. On the other hand, during the periods of high-liquidity, the price may quickly change by a multiple of the specified tick/price range. In this case, Range Bar chart might show a long trend of several bars going upwards/downwards from the previous close. However, those are not "real" bars that can be traded as they were created at the same time to fill in the price gap. We refer to such bars as null bars as they have no actual trade volume.
You can suppress the generation of the null bars by using Max Null Bar parameter. Depending on the value of this parameter, null bars are combined into one elongated bar with the size equivalent to a sum of the individual null bars. This method effectively compresses fast market price moves.
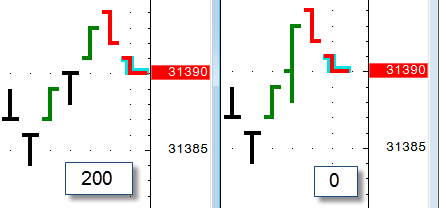
For example, a 1-tick Range Bar chart with a 5-tick price gap, e.g., price jump from 13.01 to 13.06:
•Max Null Bars = 200 -> close current bar 13.00-13.01, show 4 null bars 13.01-13.02, 13.02-13.03, 13.03-13.04, 13.04-13.05, open new real bar with current high = 13.06.
•Max Null Bars = 0 -> show no null bars, close current bar 13.00-13.05 and open new real bar with current high = 13.06.
•Max Null Bars < 4 -> we estimate that 4 null bars are going to be generated, as Max Null Bars < 4, we won’t generate null bars at all and will behave as if Max Null Bars = 0
•Max Null Bars >= 4 -> we estimate that 4 null bars are going to be generated, as Max Null Bars is >= 4, we generate all null bars as if Max Null Bars = 200
See Max Null Bars in parameters to learn how to set gap-handling preferences.
Range Bar outputs
These outputs are displayed in the cursor value box:
•Open
•High
•Low
•Close
These outputs are available in the Formula toolbox or in study parameters for studies applied to this chart type:
•Open
•High
•Low
•Close
•Mid
•HLC3
•Avg
•TrueHigh
•TrueLow
•Range
•TrueRange
•TickVol
•Vol
•RBOpen
•RBHigh
•RBLow
•RBClose
•RBMid
•RBHLC3
•RBAvg
•RBTrueHigh
•RBTrueLow
•RBRange
•RBTrueRange
|
Parameter |
Description |
|
Range Unit |
Select Tick (default) or Price. Specifies whether tick or display price scale units are used for range. For example, for EP, 25 price is the same as 1 tick, because on the price scale the minimal price change (1 tick) is equal to the change of the display price by 25. |
|
Range |
Specify range units. Default = 5 |
|
Max Null Bars |
Specify a maximum number of null bricks in case of price gaps that can be generated as one brick. If the number of null bricks to be generated due to a single price change greater than this value, then all null bricks are combined into one longer brick. Valid values: 0-200. Default value is 0, which means that the chart will not show any null bricks and will combine all null bricks into a current brick. A value of 200 means that all null bars are generated unless the number of null bars is greater than 200. The timestamp of a null brick is equal to the timestamp of the previous brick. This guarantees that the brick has the same timestamp no matter what this parameter is set to.
The timestamp of a null range bar is equal to the timestamp of the previous range bar. This guarantees that the bar has the same timestamp no matter what this parameter is set to. |
|
Color |
Select the colors for range bars. |
|
Coloring |
Highlight Up/Down Highlight 2-bar Overlap: If checked, then the portion of the previous bar’s range that overlaps the current bar’s range will be colored. Highlight 3-bar Overlap: If checked, then the portions of both of the two previous bar’s price range that overlaps the current bar’s range will be colored. Note that the smallest range of either bar is used for the range. |
|
MarkIt |
Add a condition to the study display. |
|
Display |
Select Bar, Line, or Candle for bar type. |
|
Highlight Up/Down |
Indicates up and down bars with customizable colors:
Bars that are neither up nor down are colored black (can be changed in preferences). If open < close, then highlight up (green) If open > close, then highlight down (red) If open = close, then neutral (black) |
|
Highlight Last Bar |
Indicates which bar is the most recent bar in the display:
|