Strategy menu
CQG provides a list of commonly used option strategies that have a defined structure. The list is not exhaustive, and names may be different from those used by exchanges. If a specific strategy is not included on the list, you can use a custom strategy.
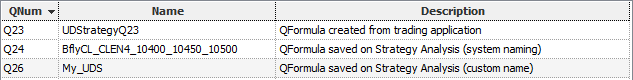
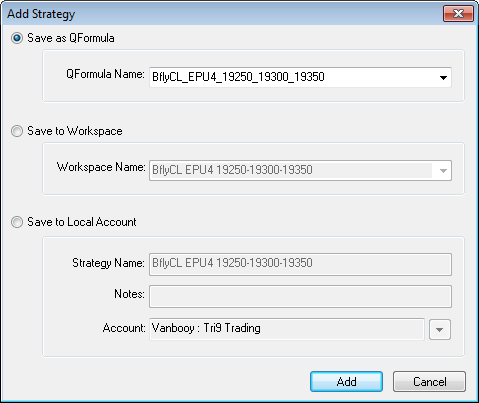
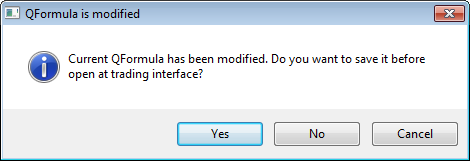
Read about user-defined strategies (UDS)
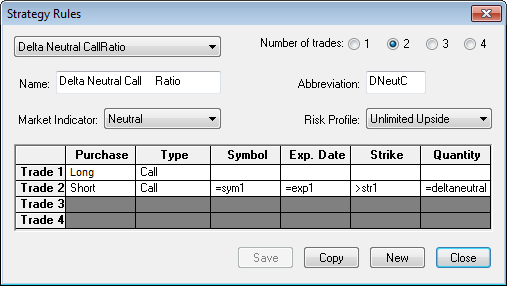
After you select a strategy, trade fields are set up according to the strategy definition. The system removes unneeded trade boxes, and trade boxes which only define the strategy, rather than the specific trade, are grayed out and cannot be changed without creating a custom strategy. See Working with the Table Pane.
To customize this list, click the Setup button, then click Customize Strategy List.
Underlying contract details
For each underlying contract in the strategy, the underlying contracts area displays last trade or settlement, historical volatility, interest rate, and days until expiration.
Plot parameters
Up to six lines may be plotted.
Since the display is re-drawn in response to market changes, the system may be calculating a large number of points very frequently. Users with a slow options model or a slow processor may want to use a lower number of points to speed up the display.
|
Parameter |
Description |
|
Model |
Select a model from the drop-down list |
|
X-Axis |
Values: Underlying Price (always for P&L) Days to Expiration (always for Time Value) Interest Rate Volatility Can only be changed for Greeks. |
|
Y-Axis |
Values: U.S. Dollars Full Points Price Units Tick Units |
|
Z-Axis (3-D) |
Values: Days to Expiration Interest Rate Volatility |
|
Points per X-Axis |
Ranges from 30 to 120 |
|
Points per Z-Axis (3-D) |
Ranges from 10-100 |
Range parameters
3-D graphs have an X-Range and a Z-Range.
Range parameters change depending on the strategy graph displayed.
•For P&L and Greeks, select a value for the X-axis and a range either by price or deviation.
•For Time Value and 3-D X and Z Range, select a range by price or automatic.
•For Table, select a value for the X-axis, a range by price, and an increment.
|
Parameter |
Description |
|
X-Axis |
Values: Underlying Price (always for P&L) Days to Expiration (always for Time Value) Interest Rate Volatility |
|
Z-Axis |
Values: Days to Expiration Interest Rate Volatility |
|
Low/High |
Set a price range. |
|
Use standard deviation range |
Select this check box to set the range as a deviations rather than price. Formula: denominator = volatility * sqrt(DTE/365); xhi = exp(+COUNT * denominator) * UPRICE; // range High value xlo = exp(-COUNT * denominator) * UPRICE; // range Low value where UPRICE = last price of the underlying instrument COUNT = number of std deviations to offset from the underlying price (1, 2, 3, etc.) DTE = minimum of the DTE for all trades of the strategy, for option not for underlying instrument (same value shown in DTE column of the very first row with the strategy name) exp() = exponential function sqrt = square root function volatility = value shown in Under Avg Vol column (specified in Volatility tab of the Strategy preferences window) |
|
Display Lines, Shades |
|
|
StdDev 1, 2, 3, blank |
Select the deviation to use. Select blank to create a custom deviation. |
|
Use automatic range |
For Volatility for the X-Axis or the Z-Axis, the system takes a range equal to 80-120% of the Underlying Average Volatility For Interest Rate for the X-Axis or the Z-Axis, the system takes a range equal to 90-110% of the Interest Rate associated with the Underlying contract. For Days to Expiration for the X-Axis or the Z-Axis, the range covers from zero up to the number of days until expiration. |
WhatIf parameters
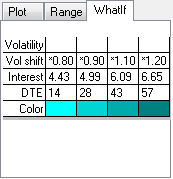
The What Ifs tab enables users to enter up to 4 what-if values for Volatility or Volatility Shift, Interest Rate, and Days to Expiration. Up to four What If lines may be added to the graph, with different constant volatilities or volatility shift factors, Interest Rates and Days to Expiration for each line. Also, a different color may be selected to display each line.
Enter values directly into the fields, or double-click the row label.
|
Parameter |
Description |
|
Volatility |
Underlying Average Volatility, as shown in the Greeks tab, is multiplied by .8, 9, 1.1, and 1.2. |
|
Volatility shift |
Allows users take into account varying volatilities of a strategy that uses multiple series. By using a Volatility Shift factor, rather than a constant volatility, users affects all series in the strategy in a similar manner, rather than having an extreme effect on a particular series in the strategy. |
|
Interest |
Default interest rate, as shown in the Underlying Contracts tab, is multiplied by .8, 9, 1.1, and 1.2. |
|
DTE |
Number of days until expiration is divided by 5. |
|
Color |
Separate colors can be assigned to each WhatIf scenario or different shades of one color can be used across the WhatIfs. |