This alert is a “contra-trend indicator which anticipates the failure to continue of the previous trend by locating entries near the beginning of a potential new trend.”
You can choose from three types of first alert signals: fast trigger (FT), slow trigger (ST), and trend reversal trigger (TRT).
It is not an absolute opportunity to buy or sell. Each signal must be considered in conjunction with other indicators and time frames. This study is best used when cross-referenced to Impulse and Corrective waves of longer time frames.
It is displayed on the chart as:
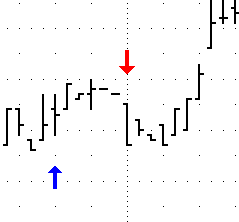
•Buy alert (Up): blue up arrow, below a bar
•Sell alert (Down): red down arrow, above a bar
Arrow color and size can be changed in parameters. You can also add a stop indicator to the chart.
First Alert parameters
|
Parameter |
Description |
|
Display |
Opens sub-window to set parameters for Up and Dn: •Color = Arrow color. •Weight = Arrow thickness. |
|
MarkIt |
Opens the Specify Conditions window. |
|
Type |
Determines which trigger line to use for the First Alert. Values: FT = Fast trigger from ATM Trigger. ST = Slow trigger from ATM Trigger and ATM Entry Zone Indicator. TRT = Trend reversal trigger from ATM Entry Zone Indicator. |
|
Anchor Period |
Highest/lowest point in the last "x" bars. Once the market establishes a new anchor point the study begins looking for the FA opportunity. |
|
Lower Threshold |
Establishes the level by which the trigger (FT, ST or TRT) needs to reach before turning up for the First Alert buy opportunity. |
|
Higher Threshold |
Establishes the level by which the trigger (FT, ST or TRT) needs to reach before turning down for the First Alert sell opportunity. |
|
Recycle |
When turned on, the study stops looking for the old FA opportunity and begin looking for the new FA opportunity when the market establishes a new Anchor Point prior to an FA opportunity. |
|
Stops |
Last exit opportunity for the FA study. This point is displayed as a horizontal bar above/below the FA. It appears if the FA begins above/below the selected chart or cross-referenced stop line. It stops advancing horizontally when the price closes below/above the lower/upper selected chart or cross-referenced stop lines. If the FA study begins below/above the selected chart or cross-referenced stop line, it does not have a horizontal stop bar. FA then uses the chart or cross-referenced stop line. |
|
Max$Risk |
Amount (in dollars) you are willing to risk per contract. The FA appears on the chart, provided the alert occurs within the dollar limits set by the user. The risk is calculated from the close on the bar that generated the FA signal to the selected chart or cross-referenced stop line. The Max $ Risk is only the pre-determined amount between the FA closing bar and the chosen stop line and makes no claim that the exit is executed within the specified dollar amount. |
|
Qualified |
When turned on, this feature eliminates ATM First Alert opportunities that appear when an opposing ATM Stop Line is being displayed. If no ATM Stop Line is displayed, then the ATM First Alert appears. If the ATM Stop Line is a Sell Stop Line, then the ATM First Alert buy displays. If the ATM Stop Line is a Buy Stop Line, then the ATM First Alert sell displays. |