Some of DOMTrader ladder elements are optional and are displayed based on the preferences you have set up. To check or change those preferences, click the Setup button, and then click Trading Preferences.
In some markets or with some formulas, the distance between bid and ask can be significant, resulting in the inability to see both extremes of the bid-ask spread on the DOM ladder.
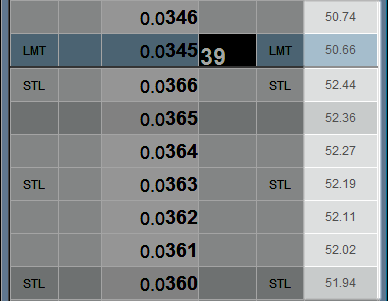
You can narrow the DOMTrader window to its minimum width, and by doing so reduce the font size of the prices, allowing a better view of the spread.
This option is best for traders who want to prioritize that bid-ask spread view over readability of prices.
Font too small? Drag the side of the DOMTrader window out until you reach a font size that works for you.
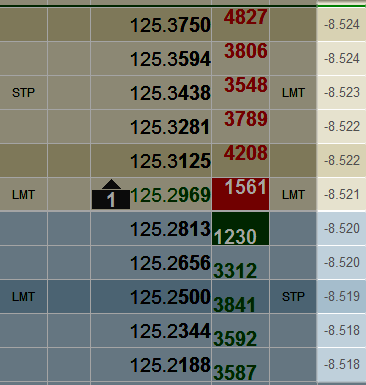
This image illustrates the smallest font size:
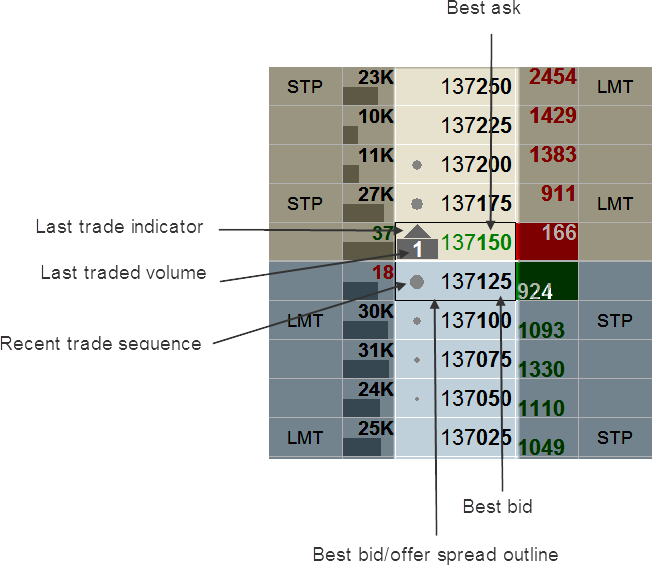
The center column on DOMTrader ladder is the price column. This column is always displayed.
The last trade indicator shows whether the last trade was higher (up arrow) or lower (down arrow) than the previous trade. If the last trade was at the same price as the previous trade, then no arrow is displayed. Displaying the last traded volume on the indicator is optional.
Pre-open indicative volume and price are represented like
this:  . Both outrights and synthetic
spreads are included in the calculation.
. Both outrights and synthetic
spreads are included in the calculation.
The best bid and best ask are indicated by green and red highlighting. The best bid/offer spread outline is indicated by the rectangle, in the case, around 136800-136750. This outline is optional.
Recent trade sequence is represented by circles of varying size indicating the prices that have been active most recently. The larger the circle, the most recently that price was traded. Recent trade sequence is optional and off by default.
You can also highlight for the spread between best bid and ask, highlight theoretical value for options, show the high and low, and highlight the average fill price.
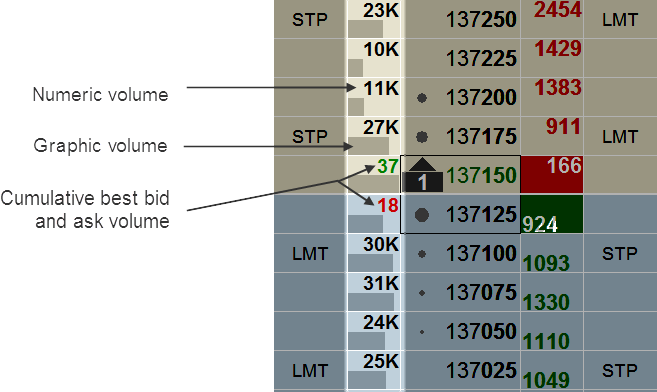
The column to the immediate left of the price column is the last trade volume column. This column is optional.
Volume can be represented both graphically and numerically.
Volume can be measured as the total for the day or for a session.
The best bid and best ask volume, measured cumulatively or based on the last trade, can be displayed in this column.
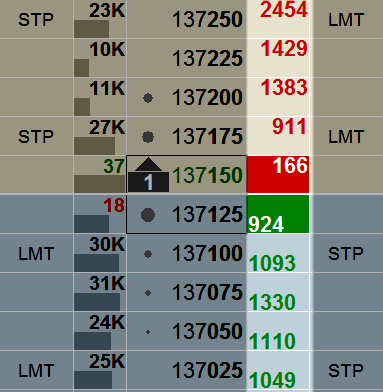
The column to the immediate right of the price column is the Depth of Market column. The data in this column is continuously updated while the market is active. This column is optional and displays combined, outright, or implied (price combined with spread prices) DOM data. Each type of DOM data is color-coded. For example, with the classic light theme:

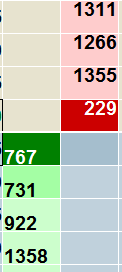
You also have the option of separating bids and asks into two columns:
The columns to the far left and the far right of the ladder are the order columns. These columns are optional, but they must be displayed to place orders using drag and drop.
Watermarks, seen here as STP and LMT, are optional. Other watermark options include order size and buy/sell.
When you drag a price to either column, a visual representation of your order is displayed.
This optional column displays the Greek value of the option at each price level.

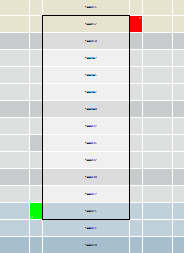
When you scroll up or down DOMTrader and your working orders are no longer visible, this order scroll bar is displayed. Click the square on the bar to jump to the order. Click this square each time you want to jump to the next order that is out of view.
On Split DOMTrader, each grid has its own scroll bar.

DOMTrader displays three market lines: high, low, and market. The green and red lines represent the maximum and minimum trade prices for the contract during the current trading day.
If there are valid best bid and best ask values, and the best ask is equal to the best bid plus tick size value, the market line is displayed. If best bid or best ask prices are not valid for the contract, of if there is a gap between the best bid and best ask rows, the market line is not displayed.

When you scroll to a price that is far enough from the current market value that the current market value would normally scroll off the screen, the system prevents that from happening.
The line across DOMTrader ladder indicates that the market window is above the selected price. Every time the current market price changes, the market window re-centers the market price row, so that it is always displayed.
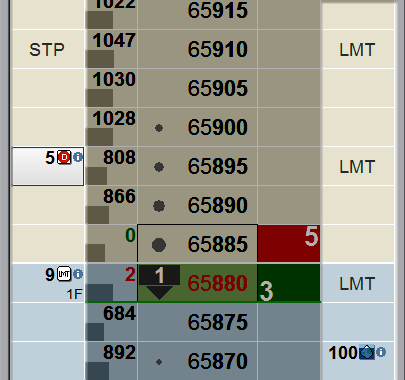
If the best bid and best ask are both displayed on DOMTrader and market movement results in DOMTrader not being to accommodate both (too great a spread), then an indicator is displayed between the two. It lets you know that there are prices missing, so that you can see both best bid and ask on the ladder. Notice the gap in this image: