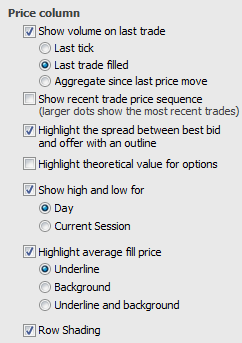
Select the check box for each element you would like to add to the price column.
|
Preference |
Details |
|
Show volume on last trade |
Last traded volume is indicated above or below the last trade indicator.
Last tick = volume of the last tick, which could be last trade, best ask change or best bid change Last trade filled = volume of the last trade only Aggregate since last price move = last trade volume is aggregated and is reset to 0 when the last trade price changes |
|
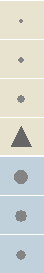
Show recent trade price sequence |
Recent trade sequence is represented by circles of varying size indicating the prices that have been active most recently. The larger the circle, the most recently that price was traded. It is on by default.
|
|
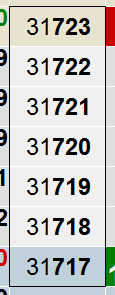
Highlight the spread… |
The spread between best bid and offer in indicated by two vertical lines to each side of the price column. It is on by default.
|
|
Highlight theoretical value… |
Theoretical values are highlighted with a T. |
|
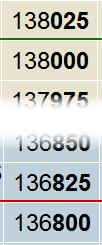
Show high and low… |
The high for the day or session is indicated by a green line across the display. Low is indicated by a red line.
|
|
Highlight average fill… |
Average fill price can be indicated with a line, shading, or both. To hide the highlighting, clear the check box. |
|
Row Shading |
Every fourth row is shaded for decimal tick size of 25/100 and tick sizes: 1/4, 1/8, 1/16, 1/32, 1/64, 1/128, 1/256, 1/512, 1/2 of 1/64, 1/8 of 1/32, 1/4 of 1/32, 1/2 of 1/32. Every fifth row is shaded for decimal tick size. In the case of fraction A/B or A/B of 1/C: •If B is less than 7, then every Bth row is shaded. •If B is greater than 7 and divisible by 5, then every 5th row is shaded. •If Bth is greater than 7 and not divisible by 5, then every B row is shaded. |