Valid 1st and 2nd Buys
Two 1st Buys only
It is Kase and Company Inc.'s philosophy to view the markets scientifically and accurately without making the procedure for doing so too complex. Through the application of statistics and mathematics a whole new generation of indicators has been made possible.
Trading is primarily a function of three tasks: entry, money management and exit. You will find that the Indicators in the Kase StatWare package will help you perform all three tasks in a more efficient and successful manner.
Where many older indicators are based on empirical observations, we now have the ability to derive indicators from the natural structure of the market itself. Patterns that were difficult to observe with primitive tools now emerge for examination. A fitting analogy would be between two warriors facing off, one using a sling shot and the other using a modern assault rifle.
This section explains these indicators and gives traders an increased understanding of the markets to diminish risk and increase profits. Keep in mind that the Kase indicators are tools, which support a methodology, and not a black box system. A trader’s personality and experience will play a role in the development of his or her ability to use Kase StatWare.
Trading Guidelines
Valid Entry Triggers
Statware defines valid buy entry triggers and valid sell entry triggers.
Buy Entry
One first class buy, 2 second or 3 third-class, or a warning sign, screened on the Permission Stochastic, accompanied by at least one third-class buy.
Sell Entry
One first-class sell, two second- or three third-class sells, or a warning sign, screened on the Permission Stochastic, accompanied by at least one third-class sell.
First vs. Second Signals
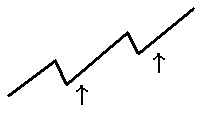
A first signal is any first-, second- or third-class signal generated, as described in the indicator section. A second buy signal is one that occurs after a pullback, wherein the previous low is held. A second sell signal is one that occurs after a pullback, wherein the highs are held.
|
Valid 1st and 2nd Buys |
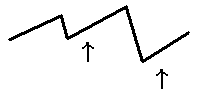
Two 1st Buys only |
|
|
|
Entry System
To initiate a trade from a “flat” position, take second signals generated.
To take first signals, a danger sign must have been generated on the higher time frame chart, usually daily, or very strong danger signs on the monitor.
Upon a confirmed signal on the monitor level, follow trades on the monitor chart.
If you wish to trade longer term, upon a confirmed entry on the daily, follow trade on the daily chart.
Re-Entry System
If stopped out under a mild correction, if both the DevStop 3 has not been violated and the previous cycle low (for longs) or high (for shorts) holds as well, reenter the entire original position on first timing signals, otherwise cycle back to normal entry rules above.
Danger Signals and Related Stop Settings
Choosing the exit point for any trade presents a set of conflicting decision processes. We want to stay in the trade through minor, random price fluctuations, in order to allow profit to accumulate; yet we do not want to allow a reversal to persist to the point that it causes substantial erosion of our gain on the trade.
To improve our decision making process on market exits, we have examined the use of three Kase indicators on our monitor chart: the PeakOscillator, the KCD and the DevStop. The PeakOscillator is used to identify extremes of trend strength, while the KCD is used to identify declining and, specifically diverging momentum. These are primary signals that portend a high probability for change in trending behavior. The DevStop is used to identify significant price points for exiting, based on recent volatility.
Exit Guideline Grid
The following chart lists the exit guidelines in order of importance:
|
Divergence on PeakOscillator AND KCD |
100% |
|
Divergence on Peak Oscillator OR KCD |
80% + Dev 1 |
|
PeakOut late in the direction of the dominant trend, or during a correction, no divergence. |
80% + Dev 1 |
|
PeakOut early in the direction of the dominant trend (often following a sharp correction) |
Dev 1, 2, and 3 equally |
The studies of the Exit Guidelines related above were performed primarily on the monitor length chart. Several observations were also confirmed on a timing length chart. Because the indicators used are statistically based, they should perform equally well on the daily chart for longer-term position holders as well.
Whenever we see divergence on the KCD and the PeakOscillator, we now exit 100% of our trade. In our study, we hit DevStop 1 95% of the time (20/21) following this signal. DevStop 2 was hit 86% of the time (18/21).
|
Divergence Indicator |
Action Taken |
Probable Outcome |
|
KCD AND Peak Oscillator |
Exit 100% of the trade |
DevStop 1 hit 95% |
|
KCD OR Peak Oscillator |
Exit 80% of the trade |
DevStop 1 hit 83% |
|
PeakOut late (with no divergence) in the direction of the dominant trend or during a correction |
Exit 80% of the trade |
DevStop 1 hit 79% |
|
PeakOut early in the direction of the dominant trend |
Stops set at DevStop 1,2,and 3 equally |
Stops hit on 37% of the time |
When in no danger, default to DevStop 3.
It has been determined that a full exit, of either a monitor or a timing chart, whichever triggers first, beats a half-and-half exit system.
If stops are hit before new signals are generated in the opposite direction, exit the trade.
If there is no profit in the trade after 5 to 8 bars, exit on inactivity.
Daily Chart Exit Rules and Stops
When in no danger, default equally to DevStops 1, 2 and 3.
Exit on the first signals in the opposite direction.
If there is no profit on the trade after 3 to 5 bars, exit on inactivity.
Otherwise same as above.
Choppy Market Trading Guidelines
When the market is in a corrective, sideways, or coalescing mode, it is prudent to modify the standard trading guidelines as follows:
Trade lighter volume, e.g., 50% vs. 100%
Remain on the timing chart for exit signals (i.e., PeakOuts, divergences, warnings, etc.), even if confirmed on the monitor chart
Exit more aggressively, e.g., 100% instead of 80%
Default to DevStop 2 instead of DevStop 3.
If you feel you are exiting too aggressively, if confirmed on the monitor chart, you may move up to the monitor chart and exit on monitor chart signals. However, lower the time frame on monitor chart, i.e., 10-15 bars/day vs. 5-8 bars.
"Analyzing Basic Fundamentals of the U. S. Energy Market,” Futures, October, 1991.
"Choosing a Time Bar Length," Technical Analysis of Stocks and Commodities, August, 1991.
"Defining Risk Management: A Strategic vs. Tactical Approach," Nymex Energy in the News, Fall, 1992.
"Futures and Flexibility," National Petroleum News, August, 1993.
"Futures Enhance Wet Barrel Trading in Specialized Markets," Nymex Energy in the News, First Quarter, 1988.
"Hedging Made Easy: A Guide for the Do-It-Yourselfer," Nymex Energy in the News, Winter, 1991/1992.
"Knowing When to Step Back From the Market," Futures, June, 1991.
"Using Stochastics to Forecast Market Moves," Nymex Energy in the News, Spring, 1991.
"Volatility and Spreads," IPE Pipeline, November, 1992.
"Why Bother With Futures," National Petroleum News, June, 1993.
“Building a Trading Framework,” Futures, November, 1996.
“Hedging is an Option for Producers,” American Oil and Gas Reporter, October, 1997.
“Hedging with Statistics," NESA Energy Journal, March, 1998.
“Hedging Without Futures,” National Petroleum News, October, 1993.
“How to Cash in on the Cash Market,” Energy Risk Magazine, March 1996.
“Locking in Storage Profits Through Hedging,” Natural Gas Hedger, June/July, 1995.
“Look Before You Leap,” Energy Risk Magazine, April, 1994.
“Momentum Divergence,” Nymex Energy in the News, Fall/Winter, 1993.
“Multi-Dimensional Trading,” Futures, May, 1996.
“New High-Probability Indicators - Energy,” Nymex Energy in the News, Spring, 1996.
“New High-Probability Indicators - Metals,” Nymex Metals in the News, Spring, 1996.
“Putting the Odds on Your Side,” Futures, April, 1996.
“Redefining Volatility and Position Risk,” Technical Analysis of Stocks and Commodities, Oct. 1993.
“Sailing With the Wind,” Energy Risk Magazine, July, 1994.
“Simplified Momentum Filters Improve Trading,” Futures, December, 1993.
“Statistics in Action,” Futures, June, 1996
“Technical Differences and Similarities: Energy and Power,” Natural Gas Journal, January, 1997.
“The Best Momentum Indicators,” Bridge Trader, May/June 1997, USA
“The Kase Dev-Stop-Accounting for Volatility, Variance and Skew in Managing Trading Risk,” International Federation of Technical Analysts, Inc. Journal, 1994, reprint from Journal of the Market Technicians Association, Summer, 1993.
“Thinking Person’s Guide to Hedging,” Energy Risk Magazine, November 1994.
“Using Probability and Monte Carlo Simulations,” Natural Gas Hedger, Aug./Sept. 1995.
“Walking Through a Trade,” Futures, June, 1996.
Trading With The Odds. Irwin Professional Publishing: 1996.
Bars Constructed from Time
The first type of bar chart is constructed from time bars. We find the total number of minutes in a session and divide it by between 1/5 and 1/8.
Setting the Bar Length Charts
Our philosophy is to “scale-up” into trades using three chart lengths. We recommend using:
•a daily chart.
•a monitor chart consisting of 1/5 to 1/8 of a day.
•a timing chart with a bar length of 1/3 to 1/5 of the monitor chart.
Number of Minutes for Monitor Chart
Use a 1/5 - 1/8 of a day monitor chart. For example, if you are setting up a chart for a commodity, which trades for 325 minutes such as crude oil, this translates to 41 to 65 minutes.
Number of Minutes for Timing Chart
The timing chart should be 1/3 to 1/5 the length of the monitor chart. Simply take the number of minutes you have chosen for the monitor and divided by either 3 or 5 to find the appropriate timing chart length.
Bars Constructed from Tick Volume
There is a second way to set up bar charts. This type of chart is the constant volume bar chart, an improvement in traditional bar charting. Each tick represents one change in price. A constant volume bar, with the flat filter parameter checked, constructed using a tick count of 20, for example, would contain the price activity over 20 price changes or ticks.
Tick volume and time are similar measures in that both are proportional to the square root of volatility and risk.
A major advantage of constant volume bars is that they are more regular, building slowly when the market is quiet and quickly when the market is busy, and thus, due to lower variability, are less risky.
Setting the Number of Ticks for a Constant Volume Bar
1. In the command entry box, type in the number 55 and press Enter.
2. Count the number of bars per day.
3. If the number is greater than 8, increase the tick bar length to decrease the number of bars until the average number of bars per day appears to be between 5 and 8. Err on the side of having more bars, not less.
If possible, use Fibonacci numbers for your CVB bar length (3, 5, 8, 13, 21, 34, 55, 89, 144, etc.), adjusting as necessary.
Additionally, use the following suggested parameters for the Constant Volume Bars:
•Flat filtering
•Ticks (for the data setting)