You can set up charts to indicate when certain specified conditions have been met and set alerts based on those conditions.
Conditions can be applied to a chart, so that if the condition is true for a particular bar, the condition symbol is displayed at that bar.
1. Right-click the chart.
2. Click Modify All Study Parameters.
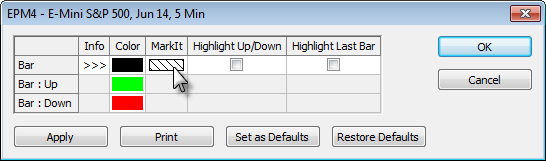
3. Click the MarkIt field to open the Specify Conditions window.
The condition inherits the formatting from the last time the condition was set (e.g. green arrow or red triangle).
Learn about using the Specify Condtions window
To remove a condition from a chart
1. Right-click the condition symbol.
2. Click Remove <condition>.
To modify a condition on a chart
1. Right-click the condition symbol.
2. Click Modify <condition> Formula to open Formula Builder and update the condition.
To change the condition display on a chart
1. Right-click the condition symbol.
2. Click Set <condition> Color to change the color.
3. Click Set <condition> Symbol to change the symbol.
To set an alert from a condition
1. Right-click the condition symbol.
2. Click Set <condition> Alert. The Condition Alerts window opens automatically and is populated with the information from the chart. If you do not wish to make changes or monitor the window, you can close it.
1. Add a study to a chart.
2. Right-click a study bar.
3. Click Select Conditions for Marking [Study]. This option is active only on primary curves (e.g. on BMA, but not BHI or BLO).
Related Topics:
Creating Conditions and User Values
Displaying Condition Values on the DOM Ladder