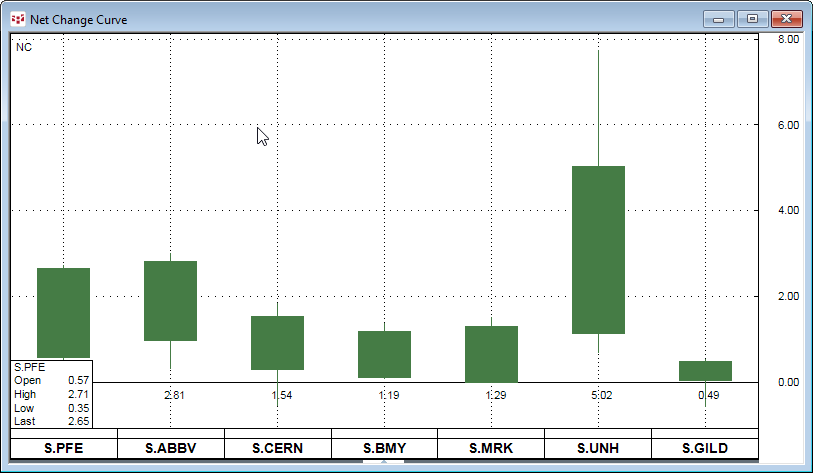
The Net Change Curve chart displays a collection of symbols’ net price change or net percentage change making it easy to compare each market’s current sessions performance (not available in QTrader).