With Signal Evaluator, you can create specific buy and sell signals to analyze for effectiveness over a particular time period as applied to both portfolios and individual commodities.
Considerable attention is paid to exits. It is, however, important to realize that no matter how good exits are, a poorly placed entry is detrimental to a successful system.
Signal Evaluator is a valuable step in system development, allowing you to expose entry point opportunities by calculating, for example, the P/L bar-by-bar for each entry point of interest.
One of the benefits of using Signal Evaluator is that creating a full-fledged trade system for analysis is unnecessary.
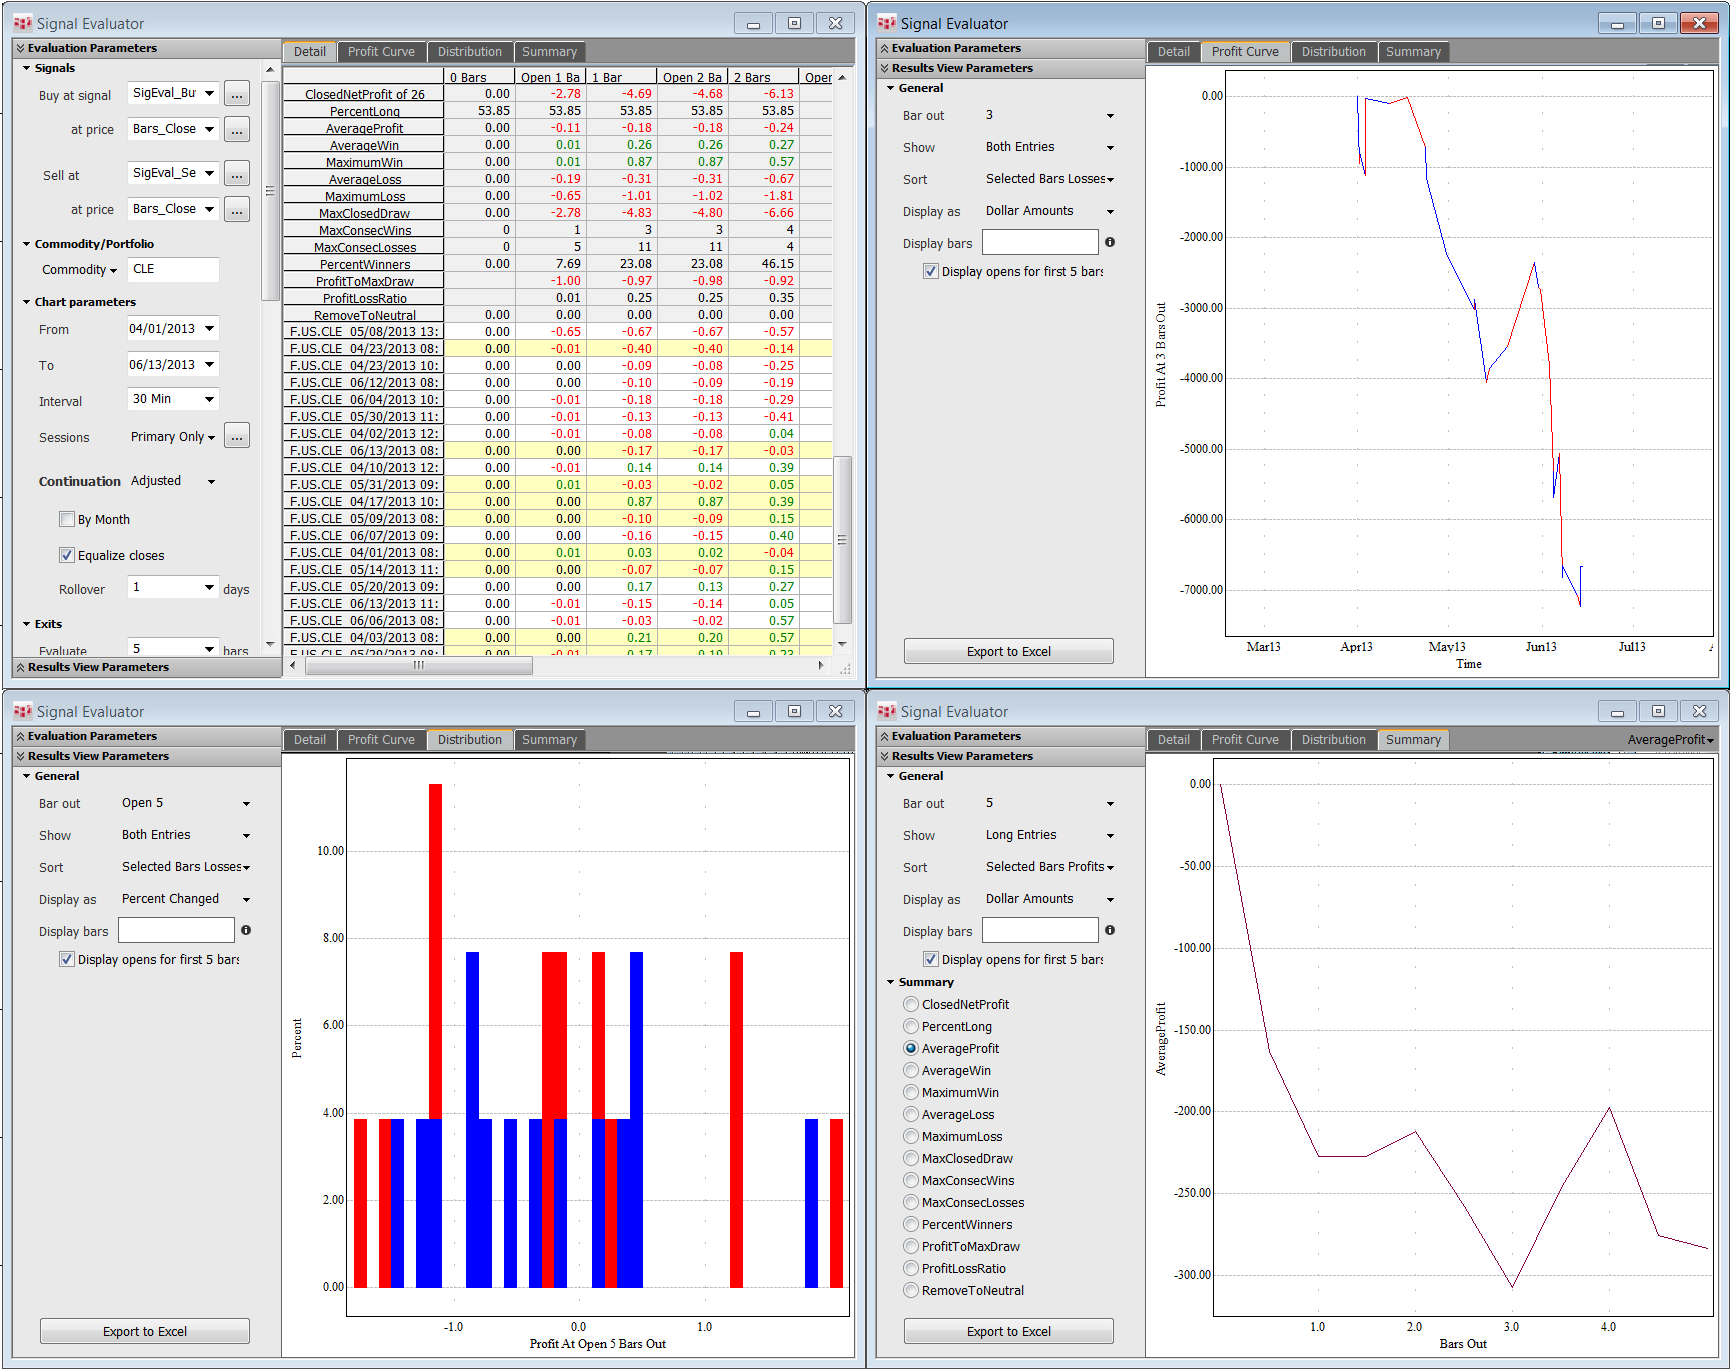
Another benefit is the visual representation Signal Evaluator provides. Data is presented not only in grids that can be exported to Excel but also in graphs and charts.
The basic Signal Evaluator workflow is straightforward: Choose the conditions and user values you want to analyze, set evaluation parameters, start the scan, and then view and filter the results. Optionally, you can export the data to Excel and open a corresponding chart for any row in the Detail grid.
To open Signal Evaluator, click the SigEval button on the application toolbar. If the button is not displayed, then click the More button, and then click Signal Evaluator. Use Toolbar Manager to add the button to the application toolbar.
Note that analysis of portfolios requires an enablement.