Momentum trading can accurately anticipate the direction and duration of “breaking” price moves by closely analyzing how quickly (or how slowly) a price is changing in a market. Used properly, momentum trading will not only protect against the two biggest market stimulants, fear and greed, but will actually capitalize on them.
This section is a step-by-step momentum-trading guide for anyone trading stocks or commodities. Whether you are an individual speculator, a broker, a CTA (Commodity Trading Advisor), or a fund manager, this analysis will be beneficial to you.
The following pages contain an analysis of the price behavior and movement of different markets. The CQG charts in this manual have been analyzed using the SMR method of trading, and it is our hope that you will spend the time necessary to learn the SMR trading rules presented in this manual. The SMR Trading System will give you a totally new perspective on how to trade using momentum oscillators.
“Charts are records of past market movements. The future is but a repetition of the past; there is nothing new. History repeats, and with charts and rules we determine when and how it is going to repeat.” ¾W. D. Gann
The SMR trading philosophy is centered on the 49-Day Moving Average as the Main Trend Indicator and the SMR Timing Oscillators.
These components provide you with the tools necessary to time and plan your trades using the SMR trading rules. To trade a particular market, we feel that the best odds occur when a market is STRONGLY TRENDING, either up or down. Once the trend has been established, you should use the SMR Timing Oscillators as a timing device to time your trades into the market.
Trend Direction
The trend of a market is an illustration of the dominant buying and selling forces of traders all over the world. It is a very reliable measure of supply and demand; the relationship between supply and demand is shown by the ups and downs of the market. When supply exceeds demand, prices will decline to a level where supply and demand are approximately equal. And conversely, when demand exceeds supply, prices will rise to a level at which supply and demand reach equilibrium. When a market is in an equilibrium stage, the daily price ranges become narrow, which we call “congestion” or “chop,” and it may take weeks or months to determine in which direction the next trend will be.
The SMR 49-Day Moving Average is used to identify trend direction and/or market congestion. The 49-Day Moving Average stems from one of the master traders of our time, W.D. Gann. Gann said that "The number seven is the most referred to of any number in the Bible,” and that the square of seven, which is forty-nine (49), brings about contraction and should be considered a death zone number. We have noticed that changes in trend tend to occur when price action trades through, or fails to trade through, the 49-Day Moving Average. A simple look at any stock or commodity chart, with the 49-Day Moving Average overlaid, will confirm this statement.
Trend Identification
The SMR studies offer 3 methods of trend identification:
•Up Trend
•Down Trend
•Congestion
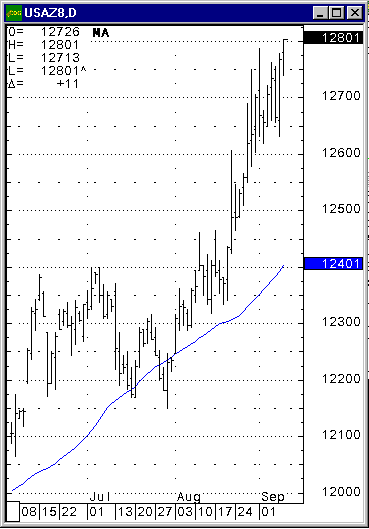
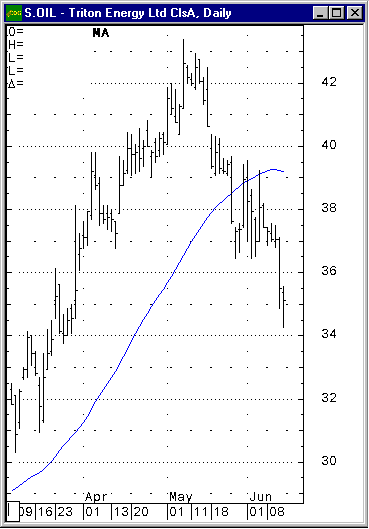
In this example below, the 49-Day Moving Average, represented by the solid line, is trending at an upward angle. The steeper the angle, the stronger the trend. The market price action tends to stay above the 49-Day Moving Average in an upward trend.
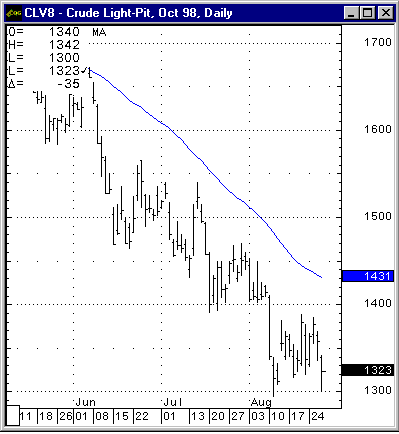
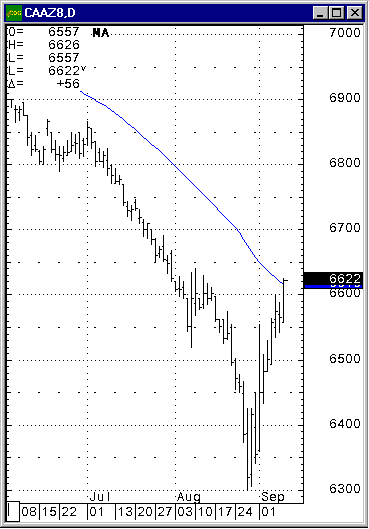
This example below illustrates a downward trend. In this case, the market price action tends to stay below the 49-Day Moving Average.
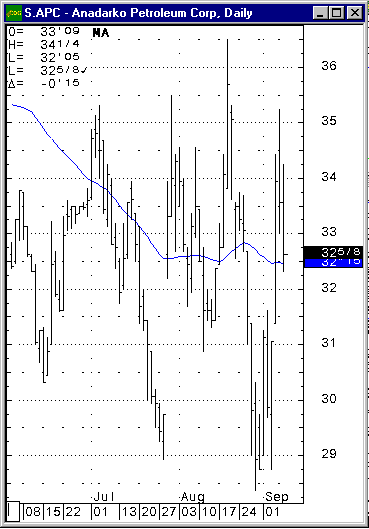
In the example below, the 49-Day Moving Average is trending in a somewhat horizontal direction (congestion). The price action of the market is moving back and forth across the moving average line, and is changing directions frequently.
Trend Change Identification Methods
Price Puncture Method: The earliest trend change indicator is when the price crosses over and closes on the other side of the 49-Day Moving Average. Many traders look to buy or sell breaks through the 49-Day Moving Average, and often the move is strong enough to be profitable. Although movement through the 49-Day Moving Average is a quick and easy way to identify a possible trend reversal, markets that trade at or close to this area tend to “whipsaw” or be choppy, and should be approached with caution. Figure 4 shows a down-trending market where a price puncture has occurred.
Five Consecutive Day Method: Another early indication of a trend change is when the market has at least five consecutive closes on the opposite side of the 49-Day Moving Average, as shown in Figure 5. Waiting five days will eliminate some risk associated with false signals experienced by using the Price Puncture Method.
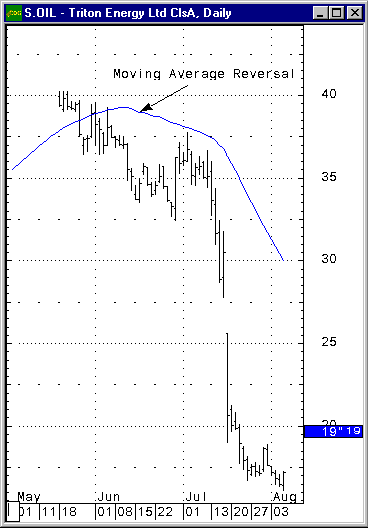
Moving Average Method: This method is the most conservative of the three approaches and is identified by the moving average itself reversing direction. Figure 6 is an example of a downtrending market that has reversed. Notice that now the price action is above the 49-Day Moving Average. While the actual reversal of the moving average is by far the most reliable indicator, it is less timely since the signal often occurs well after a move has begun.
SMR Trading Patterns
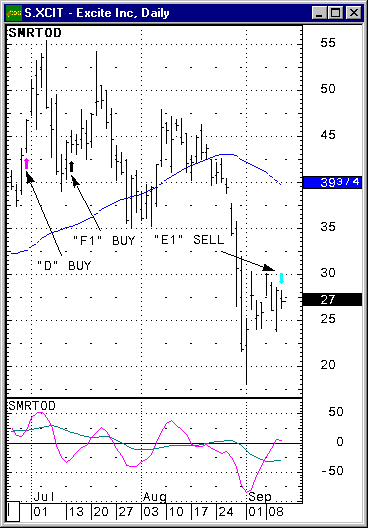
Mechanical trading signals can be presented on your CQG charts. These signals are represented by up (buy) and down (sell) arrows (see example below), where different colors denote different signals. The trading rules for the SMR signals are objective and very conservative.
As you become more adept at recognizing these patterns, you may wish to relax the rules somewhat, or use your own interpretation. One exceptional feature of the SMR charting service is that you can develop your own trading patterns as you study oscillator and price action movement. You may wish to implement your own successful trading system by using the SMR basics, as many other dedicated traders have.