
The title bar includes the symbol, contract description, contract date, and chart interval. It also indicates if continuation has been applied to the chart. Chart window title bars include an orders and positions summary.
The summary on the chart title bar is updated based on the contract selected in the active tab. Note the differences in these summaries:
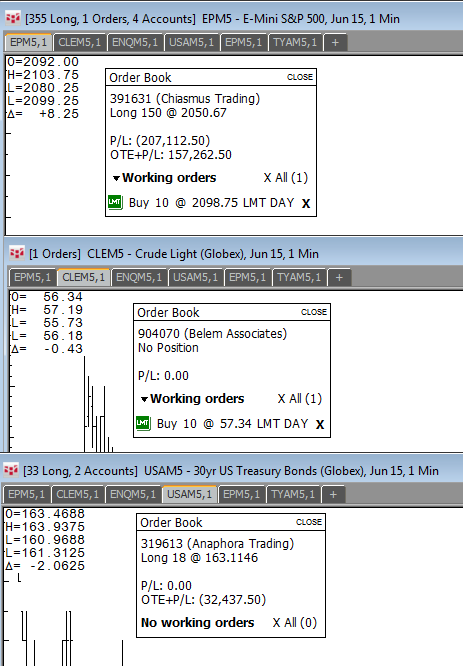
The summary for EP tells me that the sum of 4 account positions is 355 long, and there’s 1 working order.
To remove the summary from both the application title bar and chart title bar, clear the Show Dashboard Summary in the Title Bar preference (System Preferences > Misc).
The entry field is used to enter the symbol for the chart. You can also enter the chart interval in this field.
The price scale can be displayed on either the right or left of the chart. You can also choose to include labels or not. Clicking and dragging moves the scale. Read more about Price Scale.
Click and drag to the time scale to the left to choose smaller time intervals (e.g. moving from 30-min to 15-min) and to the right to widen the gap between time intervals (e.g. moving from 15-min to 30-min). Read more about Time Scale.
Bars
The bar display changes depending on the chart type.
Displays the open, high, low, last, net change, and optionally a thermometer. The Daily Value Box can be hidden by right-clicking on it, and selecting Hide Daily Value.

The thermometer illustrates the current market standing of the symbol relative to its open, high, and low prices. It shows high to last (red), low to last (green), and open (yellow triangle) for a symbol for the current day. The close or last price is indicated by the change of color from red to green. If the thermometer displays all yellow, the data is not available and you cannot trade the symbol.
It is possible for the last price in the daily value box to differ from the chart itself, as this value can be calculated from either a bid, ask, or trade. The price on the chart is always calculated based on last trade.
Add Study Details to Daily Value Box
Mouse Text
Mouse text identifies the contract; interval; time; and open, high, low, and close.

The display of mouse text is controlled in miscellaneous preferences.
Chart Add-Ons
Charts can be enhanced with both analytic and trading tools: