
You can add additional data columns and charts, studies, conditions to the monitor. Charts and studies are grouped together in columns. You can decide if they are sorted by study or by chart. Conditions are displayed in single columns.
See Adding Data Columns to the Portfolio Monitor (Column Picker) for details about working with Column Picker.
Standard column behavior:
•Click and drag the column to move it.
•Click and drag the column border to resize the column.
•To resize columns to fit, right-click any column heading, point to Resize columns, then click either Size Column to Fit or Size All Columns to Fit.
•To rename columns, double-click the column heading and type a new name. You can also right-click the heading, point to Edit, then click Rename.
•To revert to the default column name, delete the modified name and ENTER.
•To sort columns, right-click the column heading, point to Sort, then choose Ascending or Descending.
To add a chart type
1. Right-click a column heading, and click Add Chart/Interval.
2. Select chart type and interval.
3. Close the Main Preferences window.
To add studies
1. Right-click a chart or study column heading, then click Add Study.
2. Select the study you want to add to the list.
3. Click Add.
4. When you are finished adding studies, click Close.
You can also add study buttons to the toolbar. Click the Study button to begin.
To add conditions
Right-click a chart or study column heading, then click Select Conditions. The Specify Conditions window opens. Learn more about this window: Specify Conditions.
To remove columns
To remove an entire column, including sub-columns, click the column heading and press DELETE.
For chart and study columns, you can also right-click, then click Remove <condition, study, or bar>.
For data columns, right-click the heading, point to Edit, then click Remove.
To remove studies from Portfolio Manager
To remove one or more studies, right-click the symbol column heading, then click Remove Studies to open the Remove Studies window where you can select which to delete.
To modify a chart type
1. Right-click the chart or study heading.
2. Click Modify <chart>.
3. Make the desired changes.
4. Close the Main Preferences window.
To modify a study (Portfolio Monitor)
1. Right-click the study cell, then click Modify <study>.
2. Make the desired changes.
3. Close Setup Study Parameters.
A red triangle in the corner of a cell indicates that the parameters of this cell differ from the parameters of the study on the chart, i.e. they have been changed on the monitor.
To modify all studies, right-click the symbol column heading, then click Modify All Studies.
To open an order entry display
Double-click the ask price column to open a trading application in sell mode.
Double-click the bid price column to open a trading interface in buy mode.
The application opened depends on your preferences (Setup > System Preferences > Misc).
When a monitor is linked to a trading application, clicking the monitor changes the price, side, symbol, and account (if applicable) on the trading application.
To add study or condition alerts
1. Right-click the column header, point to Add Alerts, then click either Add Study Alert(s) or Add Condition Alert(s).
The alerts window opens and shows the symbol, studies, or conditions, respectively, that are included on that tab of the monitor.
2. Set parameters and actions, and turn off any alerts for studies you don’t want to use.
3. You can then close or minimize the window.
You can also right-click a cell to open alerts.
To group columns (pivot)
Right-click the chart heading, then click Pivot Column.
To hide or show columns
1. Right-click the column heading, then click Show/Hide Columns.
2. Unselect the column or columns you want to hide.
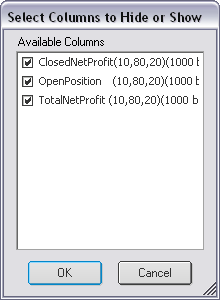
3. Click OK.