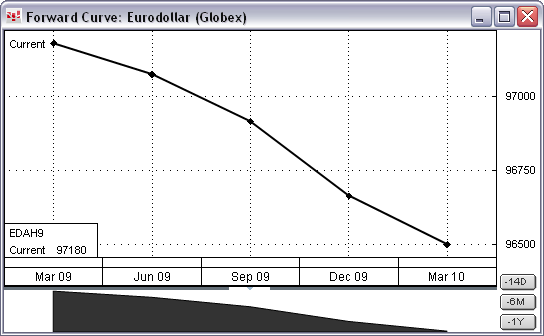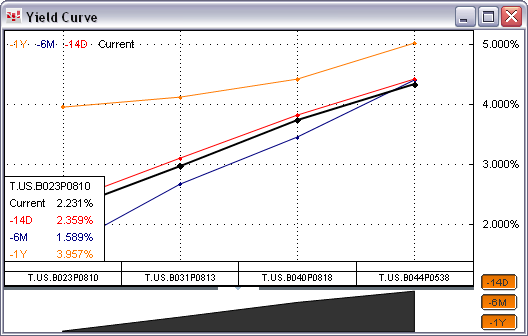
The Forward Curve and Yield Curve windows, opened from a chart, both display the curve for a market.
The forward curve charts all symbols, and the yield curve charts the yield of fixed income instruments fixed income price symbols.
The forward curve is plotted for both expired and non-expired symbols using the price of the instrument. The forward curve is updated real-time for those markets trading. The yield curve displays the yield for the fixed income instruments and is updated using real-time data.
The Forward Curve window lists the instruments along the x-axis and the prices on the y-axis. A histogram is displayed at the bottom of the window.

The Yield Curve window lists the instruments along the x-axis and the percentages on the y-axis. A histogram is displayed on this window too.

Both the forward and yield curve windows include three buttons on the bottom right corner for adding additional curves, as seen in the Yield Curve window picture.
The curves are automatically linked to the chart.