Strategy Analysis is a tool for analyzing – through changes in underlying price, time, volatility, and interest rate – the theoretical behavior of an options strategy, which consists of one or more option positions and/or underlying product positions.
To open Strategy Analysis, click the Strat button on the toolbar. If the button is not displayed, click the More button, and then click Strategy. You can also click the Options button and then click Strategy Analysis.
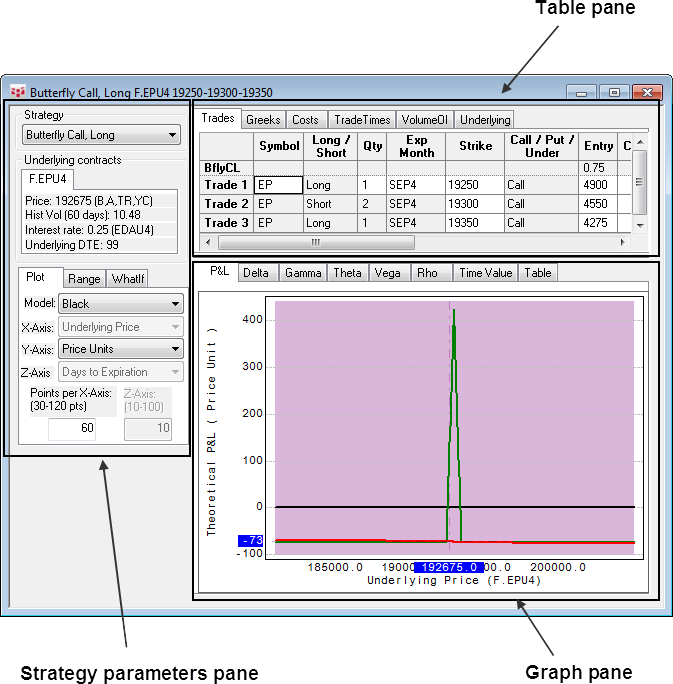
The Strategy Analysis window consists of three pans: strategy parameters, table, and graph.
|
Pane |
Description |
|
Table |
These tables provide information about the strategy’s current characteristics including the Greeks, break-even points and specific contract details, for both the total strategy and the individual parts. |
|
Graph |
The graph facilitates visual “what if” analysis of the strategy. Theoretical profit and loss (P&L) or any of the Greeks are displayed on the Y-axis. Underlying price or another variable are displayed on the X-axis. Once one or more positions are entered, the graph shows the theoretical P&L curve for the strategy, both for the current time and at expiration. |
|
Strategy parameters |
Strategy Analysis does not display a QFormula when first opened. Strategy Analysis displays a QFormula only after it has been saved or loaded. |
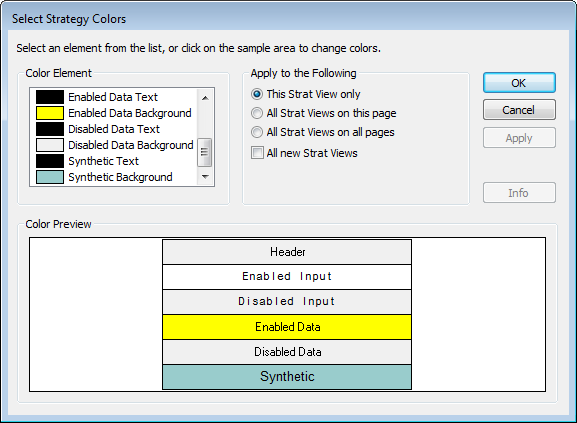
Strategy Analysis Colors
Enabled data, disabled data, and synthetic data are indicated with different colored backgrounds.